Visualizing Chemistry: 3D and the Secret Life of Molecules

The eighth podcast in the As We May Teach… series is now online:

Visualizing Chemistry: 3D and the Secret Life of Molecules

The theme for this podcast: how visualization and computational tools can make chemistry more accessible for a broader audience, and increase everyone’s understanding of the subject at the same time.

As always, the resources for this podcast are listed below. If you have questions about the tools used in the podcast, by all means please post them in the comments — I’ll be happy to answer them.


Visualizing Chemistry: 3D and the Secret Life of Molecules
Substitution to Augmentation — Visualizing Molecules
Modification to Redefinition — Computing Molecules:
Sustaining Redefinition — Exploring Molecules:

Reading Math — I: Visualization as Virtual Interpreter

This week’s podcast in the As We May Teach… series is now online:

Reading Math — I: Visualization as Virtual Interpreter

This podcast focuses on the use of visualization tools as a way to provide everyone access to mathematics as a language they can “read” and apply, even if they have not taken advanced courses in the subject.

The resources for this podcast are listed below. If you have examples of uses of visualization tools in math that you would like to share, by all means please do so via the comments.


Reading Math — I: Visualization as Virtual Interpreter
Math Literacy and Technology
Substitution to Augmentation — Interactive Demo
Augmentation to Modification — Interactive Exploration
Modification to Redefinition — Data Analysis and Exploration
Sustaining Redefinition — Pure and Applied Mathematical Exploration

Collaboration and Peer Instruction: Google Docs and Forms

A new podcast in the As We May Teach… series is now online:

Collaboration and Peer Instruction: Google Docs and Forms

This podcast concludes the “Google Docs Trilogy,” discussing uses of the Forms module to enhance collaboration, and to change the dynamics of classroom discussion. Coming next week: technology and “reading math.”

As usual, resources for this podcast are listed below; please let me know what you think via the comments.


Collaboration and Peer Instruction: Google Docs and Forms
Collaboration and the Flow of Data
Peer Instruction and ConcepTests

Synthesizing Information: Google Docs and Mashups

This week’s podcast in the As We May Teach… series is now online:

Synthesizing Information: Google Docs and Mashups

In this podcast, I outline how to use the Google Docs spreadsheet module to create mashups, and what the advantages of this approach are for data integration and visualization.

The resources for this podcast are listed below; all feedback on these resources and the podcast is welcome.


Synthesizing Information: Google Docs and Mashups
Mashup Resources
Data and Image Sources

Networked Collaboration 101: Exploring Google Docs

The next podcast in the As We May Teach… series is now online:

Networked Collaboration 101: Exploring Google Docs

This podcast takes a first look at Google Docs as a platform for collaboration, showing how it can be used for both discussion and the creation of projects that can be shared via the Web.

Resources for this podcast are listed below; suggestions for other associated resources, as well as comments on the podcast are always welcome.


Networked Collaboration 101: Exploring Google Docs

Three Easy Pieces: Putting Google Earth to Work

A new podcast in the As We May Teach… series is now online:

Three Easy Pieces: Putting Google Earth to Work

This podcast continues the exploration of Google Earth begun in the previous podcast in the context of three educational projects, ranging from economics data visualization, through literary analysis, to environmental citizen science.

The resources for this podcast are listed below; suggestions for other associated resources are always welcome — please post them in the comments.


Three Easy Pieces: Putting Google Earth to Work
Data in Place
Stories in a Landscape
Visualizing Citizen Science

As We May Teach: Educational Technology, From Theory Into Practice

I am happy to announce that, as part of a joint project with the Maine Learning Technology Initiative (MLTI), I have started a new weekly podcast series. These podcasts will look at several models for the use of educational technologies, and how to apply them in teaching via hands-on examples. The iTunes U podcasts can be found at:

As We May Teach: Educational Technology, From Theory Into Practice

The first two podcasts in the series are now online. The first, TPCK and SAMR — Models for Enhancing Technology Integration, presents the two theoretical frameworks that will guide much of the rest of the series. The second, Power in Simplicity: Virtual Thumbtacks on Virtual Maps, shows how ideas from these models can be applied to educational uses of Google Earth-generated cartography. All of the podcasts have associated online and offline resources — the ones that accompany the first two podcasts are listed below. Each weekly podcast will be accompanied by a blog post here, containing resources, as well as an opportunity for people to ask questions and provide feedback via the comments.

While the specific software and examples have been selected to be particularly useful to Maine educators, I hope these podcasts prove useful to educators in other places. If you have any thoughts about the podcasts, post them in the comments — I really would like to hear from you.

TPCK and SAMR – Models for Enhancing Technology Integration
The TPCK Model:
TPCK – Technological Pedagogical Content Knowledge
AACTE (Eds.) The Handbook of Technological Pedagogical Content Knowledge for Educators. New York:Routledge, 2008.
The SAMR Model:
Ruben R. Puentedura. Transformation, Technology, and Education. (2006)
PK Examples:
John D. Bransford, Ann L. Brown, and Rodney R. Cocking (Eds.) How People Learn: Brain, Mind, Experience, and School. (1999)
Education Resources Information Center
CK Examples:
Science Daily
Institute of Historical Research – Reviews in History
PCK Examples:
National Council of Teachers of Mathematics – Lessons and Resources
Center for Applied Linguistics – CALdigests
TK Examples:
Apple iLife Support
EDUCAUSE Learning Initiative – 7 Things You Should Know About…
TPK Examples:
The Sloan Consortium – Effective Practices
Education & Information Technology Library
TCK Examples:
Harvard-Smithsonian Center for Astrophysics – MicroObservatory
VisualComplexity
SAMR Examples:
William Shakespeare. The Tragedy of Macbeth.
Flickr Shakespeare Group
Many Eyes
UpStage
Macbeth in Second Life
TK+SAMR Examples:
GeoGebra
NetLogo
TPCK+SAMR Examples:
Prof. Wyn Kelley: MIT OpenCourseWare – 21L.003 Introduction to Fiction
Prof. Oded Meyer: Carnegie Mellon Open Learning Initiative – Introduction to Statistics
Prof. Edward L. Ayers: Virginia Center for Digital History at the University of Virginia – The Rise and Fall of the Slave South
Prof. Jon Beasley-Murray: University of British Columbia – Murder, Madness, and Mayhem: Latin American Literature in Translation
Power in Simplicity: Virtual Thumbtacks on Virtual Maps
PK:
MacEachren, Alan. How Maps Work. New York: Guilford Press, 1995.
PCK:
Monmonier, Mark. Mapping It Out. Chicago: University of Chicago Press, 1993.
TK:
Making Maps: DIY Cartography
TPK:
ESRI GIS Education Community
TCK:
Moretti, Franco. Graphs, Maps, Trees. London: Verso, 2007.
TPCK:
Stuart Sinton, Diana and Jennifer Lund. Understanding Place. Redlands: ESRI Press, 2006.
SAMR:
Google Earth
Google Earth Community

The Horizon Report at Five: Strategies for Innovation

At this year’s Educause Conference, Cyprien Lomas, Wayne Brent and I presented a workshop on strategic planning and innovation in educational technology. The materials from that workshop can be found below:

Visualizing Texts With Wordle

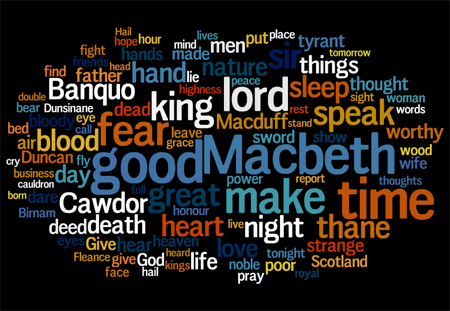
Wordle is a new free visualization tool that generates “word clouds” for any text provided. While the most immediately obvious use for the tool is to generate visualizations of tag clouds (such as those for del.icio.us), I’ve had quite a bit of fun seeing what happens when you supply Wordle with literary texts — here’s one example:

That particular image corresponds to the top 100 words in Macbeth, after removing stage directions and regularizing spelling. Analyzing the patterns that emerge will be left as an exercise for the reader…

With thanks to Alan Levine and Bryan Alexander, whose respective blog posts steered me to Wordle.